Push-Based vs. Pull-Based AI Agent Observability Pipelines: The Architecture Decision That Makes or Breaks Distributed Inference Tracing During Multi-Region Failover
There is a moment every platform engineering team dreads: a primary inference region goes dark, your AI agents are mid-task across three continents, and your observability pipeline goes silent at exactly the wrong time. The on-call engineer stares at a blank dashboard and asks the question nobody wants to answer: did our tracing survive the failover, or did we just lose every span from the last 90 seconds?
In H2 2026, this scenario is no longer hypothetical. Enterprises running distributed multi-agent systems across AWS, Azure, and GCP simultaneously are discovering that their observability architecture is not a secondary concern. It is, in fact, the foundational decision that determines whether you can reconstruct causality across a failover boundary. And at the center of that decision is a deceptively simple choice: push-based or pull-based telemetry collection.
This article breaks down both architectures with surgical precision, examines how each behaves under multi-region failure conditions, and gives you a concrete framework for choosing the right model for your enterprise AI backend in 2026 and beyond.
Why AI Agent Observability Is a Different Beast
Traditional microservice observability was hard enough. You had request-response cycles, bounded latency windows, and relatively predictable call graphs. AI agent observability is categorically different for several reasons:
- Non-deterministic execution paths: An agent reasoning loop can branch, retry, call tools out of order, or self-correct mid-execution. Trace trees are not trees; they are directed acyclic graphs with probabilistic edges.
- Long-horizon spans: A single agent task can span minutes or even hours. Traditional short-lived span buffers were not designed for this. A span that opens in
us-east-1may not close until a model call completes ineu-west-2. - Cross-model inference chains: In 2026, enterprise agents routinely orchestrate across multiple foundation models (a router model, a reasoning model, a specialized domain model, and a critic model) within a single logical task. Each hop is a tracing boundary.
- Token-level telemetry: Cost attribution, latency profiling, and safety auditing now require span-level metadata including prompt token counts, sampled logprobs, and tool-call arguments. Payload sizes are orders of magnitude larger than typical HTTP trace metadata.
These properties create pressure on your telemetry pipeline that traditional observability architectures were never designed to absorb. The push-vs-pull decision amplifies or mitigates that pressure in fundamentally different ways.
Understanding the Two Models
Push-Based Observability Pipelines
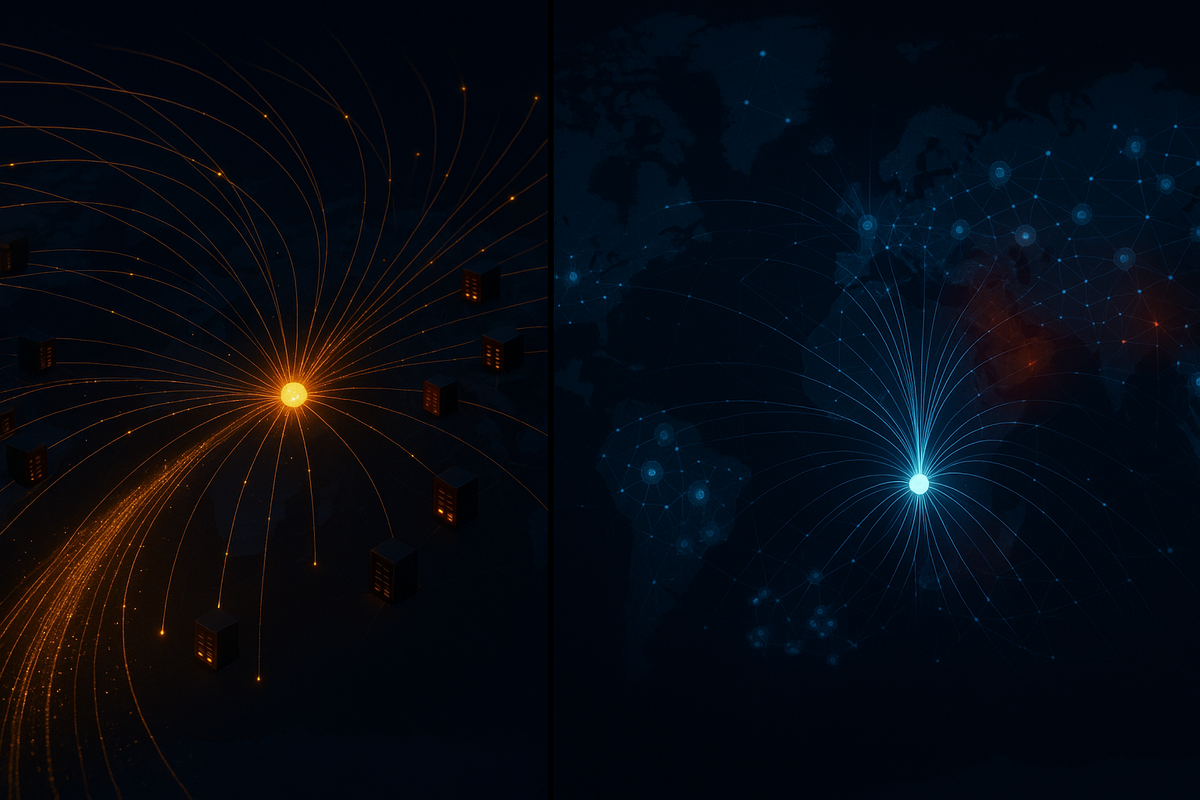
In a push-based model, each instrumented component (an agent executor, a tool-calling service, an inference gateway) actively ships telemetry data to a centralized or regional collector as spans are generated. The data flows outward from the source. Common implementations include OpenTelemetry exporters sending to an OTLP receiver, agents emitting to a Kafka topic, or SDK-level hooks posting to a vendor collector endpoint.
The push model is the dominant pattern in most enterprise AI stacks today, largely because it maps naturally onto how OpenTelemetry SDKs work out of the box. You instrument your agent framework (LangGraph, AutoGen, CrewAI, or your in-house orchestrator), configure an OTLP exporter, and spans flow to your backend collector continuously.
Key characteristics of push-based pipelines:
- Data is emitted in near-real-time as spans close
- The producer controls the emission schedule (batch intervals, queue sizes)
- Network pressure originates at the agent nodes
- Backpressure handling is the responsibility of the SDK or exporter
- Collector availability is a hard dependency for reliable delivery
Pull-Based Observability Pipelines
In a pull-based model, the telemetry backend periodically scrapes or fetches telemetry data from instrumented components on a defined schedule. The classic example is Prometheus scraping metrics endpoints, but the pattern extends to log shipping agents polling local buffers, and increasingly to AI observability platforms that expose a scrape-compatible span endpoint.
Pull-based pipelines for AI agent tracing are less common but are gaining serious traction in 2026 as enterprises deal with the specific failure modes that push architectures expose during regional outages. In this model, the agent runtime writes spans to a local durable buffer (an on-disk ring buffer, a sidecar process, or a local SQLite/RocksDB store), and a regional scraper or the central backend retrieves them on a polling interval.
Key characteristics of pull-based pipelines:
- The backend controls the collection schedule
- Producers are decoupled from collector availability
- Local buffering is a first-class architectural concern
- Scrape intervals introduce a latency floor on trace visibility
- Horizontal scaling of collection is managed at the scraper layer
The Multi-Region Failover Stress Test
Here is where the architectural difference stops being theoretical. Consider a realistic enterprise topology in H2 2026: you have agent workloads running across three AWS regions (us-east-1, eu-central-1, ap-southeast-1), with a centralized observability backend in us-east-1. Your inference traffic is globally load-balanced. A BGP routing incident isolates eu-central-1 from the central collector for 4 minutes.
What Happens to a Push-Based Pipeline
During the isolation window, agents in eu-central-1 continue executing. Their OTLP exporters attempt to push spans to the central collector and fail. Depending on your SDK configuration, one of three things happens:
- Spans are dropped: If the exporter's in-memory queue overflows (a common default when batch intervals are short and queue sizes are not tuned for outage duration), spans are silently discarded. Your trace for any agent task that was mid-flight during the outage will have gaps. You will never reconstruct what happened in
eu-central-1during those 4 minutes. - The agent process degrades: If the exporter is configured with synchronous delivery or aggressive retry logic, the backpressure from failed network writes can consume thread pool capacity and memory, causing the agent runtime itself to slow down or crash. You traded observability reliability for inference reliability.
- Data survives in a regional relay: If you have deployed a regional OpenTelemetry Collector as a buffer (the recommended pattern), spans are queued locally and flushed when connectivity is restored. This works, but it requires you to have pre-provisioned regional collector infrastructure, sized correctly for outage duration, with its own high-availability story.
The critical insight: push-based pipelines make collector availability a prerequisite for data durability. In a multi-region setup, this means your observability SLA is bounded by the weakest network path between any agent region and your collector.
What Happens to a Pull-Based Pipeline
During the same 4-minute isolation window, agents in eu-central-1 continue writing spans to their local durable buffers. The scraper cannot reach them from the central backend, so no collection occurs. But the spans are not lost; they are sitting on durable local storage, waiting.
When connectivity is restored, the scraper resumes polling and collects all buffered spans, including their original timestamps. The central backend reconstructs the full trace, including the gap period, with correct temporal ordering. The 4-minute window appears in your trace timeline with accurate causality intact.
The trade-off is visibility latency. During normal operations, a pull-based pipeline introduces a scrape-interval delay (typically 15 to 60 seconds) between a span closing and it appearing in your observability backend. For real-time alerting on agent failures, this is a meaningful gap. You cannot alert on a span you have not yet scraped.
Head-to-Head Comparison: Six Critical Dimensions
1. Data Durability Under Network Partition
Push wins when: You have pre-deployed regional relay collectors with durable queuing (e.g., Kafka-backed OTLP collectors) in every agent region. This is achievable but operationally expensive.
Pull wins when: You need data durability without pre-provisioned per-region collector infrastructure. Local buffering is a simpler primitive to reason about and operate.
Verdict: Pull has a structural advantage for durability in multi-region topologies without significant infrastructure investment.
2. Real-Time Alerting and Anomaly Detection
Push wins clearly. Spans arrive at the backend within milliseconds to seconds of closing. You can alert on agent errors, token budget overruns, tool-call failures, or safety violations in near-real-time. For production AI agents making consequential decisions (financial transactions, infrastructure changes, medical record updates), this latency profile is non-negotiable.
Pull introduces a latency floor equal to the scrape interval. A 30-second scrape interval means an agent could fail, retry 10 times, and exhaust its context window before your alerting system fires. This is a serious operational liability for high-stakes agent workloads.
Verdict: Push wins on alerting latency, and for most production AI agent systems, this matters enormously.
3. Operational Complexity and Infrastructure Cost
Push at scale requires a collector fleet sized for peak telemetry throughput, with backpressure management, queue tuning, and regional relay architecture to handle failover. In 2026, a large enterprise running thousands of concurrent agent tasks can generate millions of spans per minute. Collector fleet sizing is a non-trivial capacity planning exercise.
Pull at scale shifts complexity to the scraper layer and local buffer management. You need to ensure local buffers do not fill up during extended outages, that scraper targets are discoverable (service discovery for agent pods is a real problem in dynamic Kubernetes environments), and that scrape intervals are tuned per workload type. The complexity is different but not necessarily lower.
Verdict: Roughly equivalent complexity, distributed differently. Push complexity lives at the collector; pull complexity lives at the buffer and scraper layers.
4. Cardinality and Payload Size Handling
AI agent spans carry high-cardinality metadata: model IDs, tool names, prompt hashes, session IDs, agent role identifiers, and token counts. In push-based pipelines, high-cardinality bursts (a fleet of agents all completing long tasks simultaneously) create ingestion spikes at the collector. Rate limiting and sampling decisions must be made at the exporter or collector level, often under time pressure.
In pull-based pipelines, the scraper controls ingestion rate naturally. The backend pulls at a pace it can handle, and the local buffer absorbs production bursts. This is a meaningful advantage for workloads with spiky telemetry profiles, which describes most agent systems running batch reasoning jobs or scheduled multi-step workflows.
Verdict: Pull has a natural flow-control advantage for high-cardinality, bursty AI agent telemetry.
5. Trace Completeness Across Agent Handoffs
When an agent in us-east-1 delegates a subtask to a specialized agent running in eu-central-1, the parent span and child span exist in different regions. Reconstructing the full distributed trace requires correlating spans across regional collection points using a shared trace ID and parent span ID.
In push-based pipelines, both spans are forwarded to the central backend (assuming no network partition), and the backend assembles the complete trace. This works well under normal conditions.
In pull-based pipelines, the scraper must collect from both regions before trace assembly can occur. If one region's scrape is delayed, the trace appears incomplete until the next scrape cycle. This creates a window where partial traces are visible in the UI, which can confuse on-call engineers during incidents.
Verdict: Push provides faster cross-region trace assembly under normal conditions. Pull provides more complete traces after failover recovery.
6. Security and Compliance Posture
Enterprise AI systems in regulated industries (financial services, healthcare, government) face strict requirements around where telemetry data can flow and who can initiate network connections. Pull-based architectures allow agent nodes to be entirely inbound-closed from a network policy perspective. The scraper initiates connections; the agent node only needs to expose a local endpoint on a loopback or private network interface. This is a meaningful security posture advantage in zero-trust network environments.
Push-based pipelines require agent nodes to initiate outbound connections to collector endpoints, which must be explicitly permitted in egress firewall rules and often require mTLS configuration for each exporter destination.
Verdict: Pull has a cleaner security posture in zero-trust and regulated environments.
The Hybrid Architecture: What Leading Enterprises Are Actually Building in 2026
The most sophisticated enterprise AI platform teams in 2026 are not choosing one model exclusively. They are building hybrid pipelines that use push for real-time signals and pull for durable, complete trace reconstruction. The architecture looks like this:
- Push path (hot path): Agent runtimes push a lightweight, sampled stream of critical signals (errors, latency outliers, safety flags, cost anomalies) to a regional relay collector over OTLP. This feeds real-time dashboards and alerting systems with sub-10-second latency. Spans on this path are sampled aggressively (head-based sampling at 1-5% for routine tasks, 100% for flagged sessions).
- Pull path (cold path): Agent runtimes write all spans to a local durable buffer (a sidecar process backed by a write-ahead log). A regional scraper collects the full, unsampled span corpus on a 30-60 second interval. This feeds the long-term trace store used for post-incident analysis, compliance auditing, model performance evaluation, and cost attribution.
- Failover behavior: During a regional network partition, the hot path degrades gracefully (alerts stop, dashboards go stale), while the cold path accumulates locally and recovers completely when connectivity is restored. The operations team knows the difference and responds accordingly.
This hybrid model accepts a deliberate trade-off: you get real-time visibility under normal conditions and complete historical fidelity after failover recovery. The two paths serve different consumers (the on-call engineer vs. the post-incident reviewer) and are sized and operated independently.
Implementation Checklist for Enterprise Teams
If you are designing or auditing your AI agent observability pipeline for H2 2026 multi-region readiness, work through this checklist:
- Define your RTO for trace visibility: How long can your observability backend be blind during a regional failover before it becomes an operational crisis? This number determines whether you need real-time push or can tolerate pull latency.
- Audit your in-memory queue sizes: If you are running push-based OTLP exporters, calculate the maximum number of spans your in-memory queue can hold and divide by your peak spans-per-second rate. That is your outage tolerance window before data loss begins.
- Instrument your local buffer durability: If you are building a pull or hybrid path, ensure your local span buffer survives process restarts (write-ahead log or equivalent). An in-memory buffer that clears on pod restart is not a durability primitive; it is a false sense of security.
- Test your scraper discovery under Kubernetes churn: In dynamic environments, pods come and go. Your scraper must handle target discovery failures gracefully and not skip scrape cycles for recently-restarted pods that have buffered spans from before the restart.
- Validate cross-region trace assembly: Inject a synthetic distributed trace that spans two regions and verify that your backend correctly assembles it under normal conditions and after a simulated partition recovery.
- Model your telemetry cost at scale: Token-level span metadata is large. A single agent task with 10 tool calls and a 32K-token context window can generate spans with tens of kilobytes of metadata. At thousands of concurrent tasks, this is gigabytes per minute. Size your pipeline accordingly.
Conclusion: The Architecture Decision Is a Risk Management Decision
The push-vs-pull debate for AI agent observability pipelines is ultimately a question of which failure mode you are willing to accept. Push-based pipelines optimize for real-time visibility and accept the risk of data loss during network partitions, unless you invest in regional relay infrastructure. Pull-based pipelines optimize for data durability and accept a latency floor on trace visibility, along with the operational complexity of local buffer management.
In H2 2026, as enterprise AI systems take on increasingly consequential workloads across globally distributed infrastructure, neither trade-off is obviously correct in isolation. The teams building the most resilient observability stacks are treating this as a dual-path problem: push for the signals that need to be seen now, pull for the data that needs to be complete always.
The worst outcome is not choosing the wrong model. The worst outcome is choosing neither deliberately, defaulting to whatever your observability vendor ships out of the box, and discovering the gap when a BGP incident takes down your primary region at 2 AM and your trace dashboard shows nothing but empty panels for the 90 seconds that matter most.
Design your pipeline before the failover. Not during it.